Previous Page

Mulligan Security - 2025-02-07

Server Monitoring

What is server monitoring?

When deploying compute resources (bare-metal, VPSes or more abstract work units) you will have to manage a living system. This system will always have the following characteristics:
  • Limited ressources: the amounts of RAM and CPU cycles, network bandwidth as well as storage space are neither infinite nor free.
  • Evolving requirements: depending on how you use your services, how many concurrent users you have you might need more or less ressources than what you initially purchased
  • Nominal operating parameters: range of RAM and CPU use, temperatures and so on in which your service performs as expected


The first item is fixed and only linked to your financial constraints. The other two are constantly evolving and thus must be monitored.

What if I don't?

If you don't properly monitor your infrastructure you will face the following consequences sooner or later:
  • service instability: you won't notice when things start going awry
  • costs overrun: you will end up paying more than you need to in order to deliver the same service
  • undetected attacks: attacks that impact your services can go unnoticed when the cues (eg: high RAM consumption from a cryptojacking) are not picked up

How do I do it?

How you monitor your systems can vary based on your technical requirements. It can be as simple as logging in once a week, check the output of some diagnostic command and calling it a day.
This will give you a snapshot but you will miss a lot of important information.

You can also set up a complicated system that reports current metrics, trends and gives you capacity planning alerts based on the data obtained! You will have to find the middle-ground yourself, this article will propose one that you can tweak whichever way you need.

Risks of doing it improperly

Accessing your server for monitoring purposes is, from a risk perspective, pretty much the same as doing any other administration task or interacting with the services hosted therein. If done improperly (say logging in over the clearweb from your home address) you've just given anyone looking an undeniable link between your overt identity and your clandestine activities.

A fail-closed system is what you should strive for: opsec best practices should be the default and if there's a technical issue preventing you from following them (attack on tor, flaky network, client or server-side misconfiguration) the system should prevent access at all in order to keep you safe.

Basic tools

Let's look at a cryptojacked server... In this case the intruder did not take any precautions or try to hide their activity. This often happens with basic scripts that scan the internet in large-scale low-cost credential stuffing attacks.

glances

Here we will look at glances. Glances is a python tool that gives nice looking visuals with information about server status

Pros

  • looks nice

Cons

  • Requires python
  • not part of the POSIX convention
  • somewhat resource intensive for limited hardware
  • Only shows point-in-time data, no history
  • No alerting whatsoever

top

Now, an oldie but a goodie: top! Wherever you find a unix you'll find top, from MacOS to BSD...

Pros

  • Lightweight
  • POSIX Compliant

Cons

  • Ugly
  • limited ordering/filtering features compared to glances
  • Only shows point-in-time data, no history
  • No alerting whatsoever

Risks

Whenever you connect to your server, such as for monitoring or other administrative tasks, if you do so through the clearweb then you are liable to being recorded. Even when using SSH you will leave a trail of metadata all the way back to your access point. That might be enough to get your door busted down the line.

In the following part of the post we will look into how to set up advanced monitoring tools so you don't have to keep an eye on a bunch of tmux sessions with glances/top open in order to know the behaviour of your systems over time.

First, you need to read and understand how to connect to your server safely and anonymously (see this article), grok it and then come back here.

...
...
Done? Let's proceed.

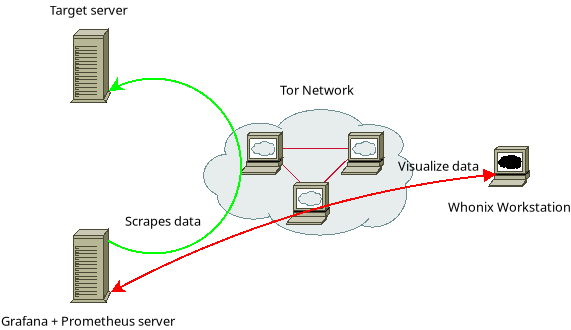
Target Architecture

First, let's have a look at the network topology we'll be building:

Setting up the Server

First you want to set up your central monitoring server. For ease of use and better performance we are going to colocate the prometheus collector along with grafana.

Tor Configuration

The prometheus collector will only be accessed locally by grafana so it doesn't need to be accessible over tor. Grafana, on the other hand, does.
Let's start with our torrc:

AutomapHostsSuffixes .onion,.exit
DataDirectory /var/lib/tor
SOCKSPort 127.0.0.1:9050 IsolateDestAddr
HiddenServiceDir /var/lib/tor/onion/grafana
HiddenServicePort 80 127.0.0.1:2700
ClientOnionAuthDir /var/lib/tor/auth_keys
And that's all you'll need! one hiddn service for grafana.
You'll find your hostname in /var/lib/tor/onion/grafana/hostname.

Prometheus server configuration

clean and simple: we scrape our server every 10s for new data, configure a proxy URL so scraping happens over tor, using our socksport and configure ou scraping targets.
modify the prometheus.yml file (most likely located in /etc/prometheus)

global:
  scrape_interval: 10s
scrape_configs:
- job_name: nodes
  proxy_url: socks5h://localhost:9050
  static_configs:
  - labels: {}
    targets:
    - [fill later with our client .onion address]:9002

Setting up the client

On the client it's even easier.

Tor Configuration

Since prometheus works on a pull model, you will need to expose your node exporter, no need for a socks proxy either.

AutomapHostsSuffixes .onion,.exit
DataDirectory /var/lib/tor
HiddenServiceDir /var/lib/tor/onion/prometheus
HiddenServicePort 9002 127.0.0.1:9002
Next, you need to install the prometheus-node-exporter. Depending on your distribution of choice it's very likely it's in your package manager under that name.
and here is how we will start it in our unit file (created in /etc/systemd/system/prometheus-node-exporter.service) :


[Unit]
After=network.target

[Service]
CapabilityBoundingSet=
DeviceAllow=
DynamicUser=false
ExecStart=/bin/node_exporter \
  --collector.systemd \
   \
  --web.listen-address 127.0.0.1:9002 --collector.ethtool --collector.softirqs --collector.tcpstat --collector.wifi

Group=node-exporter
LockPersonality=true
MemoryDenyWriteExecute=true
NoNewPrivileges=true
PrivateDevices=true
PrivateTmp=true
ProtectClock=false
ProtectControlGroups=true
ProtectHome=true
ProtectHostname=true
ProtectKernelLogs=true
ProtectKernelModules=true
ProtectKernelTunables=true
ProtectSystem=strict
RemoveIPC=true
Restart=always
RestrictAddressFamilies=AF_UNIX
RestrictAddressFamilies=AF_NETLINK
RestrictAddressFamilies=AF_INET
RestrictAddressFamilies=AF_INET6
RestrictNamespaces=true
RestrictRealtime=true
RestrictSUIDSGID=true
RuntimeDirectory=prometheus-node-exporter
SystemCallArchitectures=native
UMask=0077
User=node-exporter
WorkingDirectory=/tmp

[Install]
WantedBy=multi-user.target
 

Do note that the name of the executable might change based on your distribution. What it does:
  • collect systemd data (services and so on)
  • collect internet throughput data
  • wifi information
  • cpu interrupts information
And make them available to your server.

Right now, if an attacker could find your hidden service URL they could harvest this data about your server, you need to secure it by adding a key that will only allow your aggregator to connect
Let's generate a keypair:

 user@computer$ tor-client-auth-gen 
private_key=descriptor:x25519:3B6CE5X4I4XGXA5TDQWQONLLAJ6B5FQNPTBOFSF4AN6K6AJUXBOQ
public_key=descriptor:x25519:H7O5I7HUGLFM4IMPHNRN6L4S6TG4KJYDBXTYGOYJOUHH5NXVPJVA
 
The private_key line must be copied to the following path on your prometheus aggregator: /var/lib/tor/auth_keys/prometheus.auth_private, prepended with your target onion address like this

 mymonitoredserver.onion:descriptor:x25519:3B6CE5X4I4XGXA5TDQWQONLLAJ6B5FQNPTBOFSF4AN6K6AJUXBOQ
 
The public_key must be added on the monitored server at the following path: /var/lib/tor/prometheus/authorized_clients/server.auth with the following content

descriptor:x25519:H7O5I7HUGLFM4IMPHNRN6L4S6TG4KJYDBXTYGOYJOUHH5NXVPJVA
 
That way, only your monitoring server will be able to authenticate and scrape data from your monitored server.

Grafana has its own authentication system and database, still it reamins a critical service and it's not immune from 0 days and vulnerabilities that could be leveraged to obtain access. In order to apply a defense in depth principle we are going to do the same exercise for it:

 user@computer$ tor-client-auth-gen 
private_key=descriptor:x25519:FD7NAZTGZAXA6CTXNXR3JCVSKAPW23EP5EQOUMXKRQCKACEVUJ7A
public_key=descriptor:x25519:OBIIXC3MWQ4VCEUS7Z6LOMOQG3CFP77SSWE45EDITP55WHVZFM6Q
 
We'll put the public key on our monitoring server at /var/lib/tor/grafana/authorized_clients/admin.auth
and our public key on our whonix workstation at /var/lib/tor/auth_keys/grafana.auth_private
That way, even if an attacker discovers your grafana instance URL and has in their possession either your password or an exploit allowing them to do an authentication bypass they still won't be able to get in unless they also break the encryption underpinning the tor network.

Connecting to our grafana instance

On your monitoring server you can find your hostname at /var/lib/tor/grafana/hostname. Use it in the tor browser to reach your instance. You might be prompted for your private key if tor browser doesn't use your system's tor daemon. To avoid that you can change its connection settings.

Configuring the data sources

Next we need to tell grafana to use prometheus as a data source:

Now, let's configure it (specifying localhost:9001 as the API port)

And Voila! we have simple system monitoring over tor in a dashboard:

Conclusion

In this article we saw why and how you need to implement anonymous server monitoring for your infrastructure. If you are running hidden services with any form of sensitive data stored on them, having them under constant monitoring is a must but this monitoring must not compromise your identity or the rest of your infrastructure.

Nihilism

Until there is Nothing left.


Creative Commons Zero: No Rights Reserved

About Mulligan Security

Donate XMR:
86NCojqYmjwim4NGZzaoLS2ozbLkMaQTnd3VVa9MdW1jVpQbseigSfiCqYGrM1c5rmZ173mrp8RmvPsvspG8jGr99yK3PSs


Contact: mulligansecurity@riseup.net
website
SimpleX