13 KiB
| author | date | gitea_url | xmr | tags | |
|---|---|---|---|---|---|
| MulliganSecurity | 2025-06-04 | http://git.nowherejezfoltodf4jiyl6r56jnzintap5vyjlia7fkirfsnfizflqd.onion/nihilist/blog-contributions/issues/223 | 82htErcFXbSigdhK9tbfMoJngZmjGtDUacQxxUFwSvtb9MY8uPSuYSGAuN1UvsXiXJ8BR9BVUUhgFBYDPvhrSmVkGneb91j |
|
The case for alerting
As you know, monitoring is important when running any kind of operations, especially so for clandestine ones.
Alert Types
There are basically two types of alerting mode:
- Organic mode: you keep a running screen with visualization for your important metrics within your field of view all day, learn by osmosis what "normal" looks like so you can react when something abnormal appears
- pros
- easy to set up
- great for catching complex conditions, you subconscious does all the work
- cons
- messy and unreliable
- only works if you are in front of the screen
- pros
- automated mode: you monitoring alerts you when some conditions are met
- pros
- reliable
- customizable: you define the exact context you want, how you want to receive alerts
- runs 24/7
- cons
- will only catch issues for conditions you explicitely defined
- can't come up with alert amelioration ideas
- pros
Associated Risks
As your perimeter and infrastructure grows, as you add more servers your system complexity will shoot up exponentially. Simple organic alerting shows its limit when you have to correlate logs and behaviors across multiple systems. That's why you need alerting, if an adversary decides to stealthily probe at your infrastructure and you know what to look for you will see their attempt for what it is. Choosing to remain in the dark about it is foolish at best and irresponsible if you are part of an outfit as your laziness will put others in harm's way.
But alerting carries risk too!
Indeed. Today we will keep building on the monitoring tutorial.
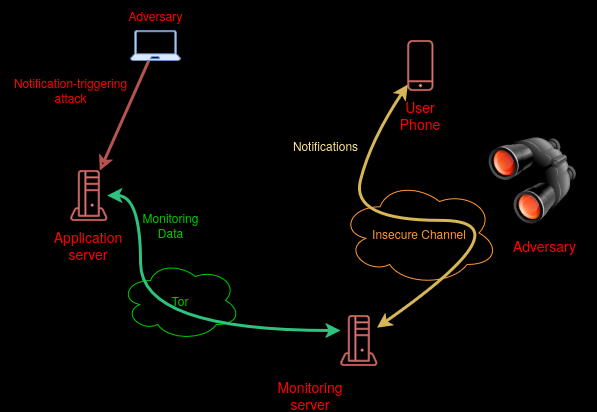
Alerts can be used to deanonymize you. If an adversary suspects that you or others are tied to a clandestine infrastructure, they might decide to trigger alerts (say, bruteforcing one of your endpoints) and see if you receive notifications through channels they control.
Grafana supports a large number of possible alerts methods, most of them unfit to our purpose as those channels can be watched by the adversary.
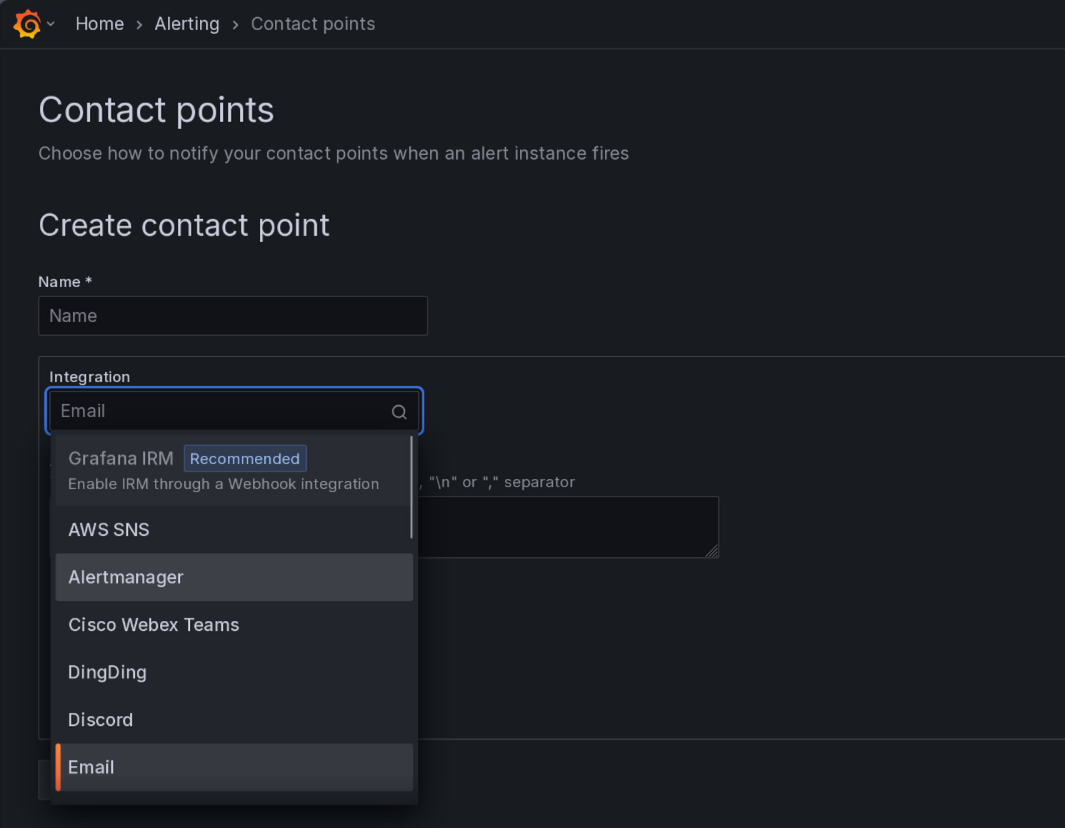
- Telegram: opaque and centralized, tied to phone numbers
- AWS, Cisco, DingDing, Slack, Discord... same issue
- Email: you can control it but it still is traceable and tied to a domain name and clearweb infrastructure with all the accompanying metadata
- webhook: simply call an arbitrary URL with the alert message => that's the way to go with the most control for ourselves
Tools of the trade
Let's start with webhooks. Webhooks are a great swiss-army knife when you need a system to act on its environment. They only need an http endpoint and the ability to make http request. They can easily be run as onion services too!
For this tutorial, Mulligan Security open sourced the tool they use for their own infrastructure: the grafana-simplex-alerter
This will be used with the simplex-chat CLI client.
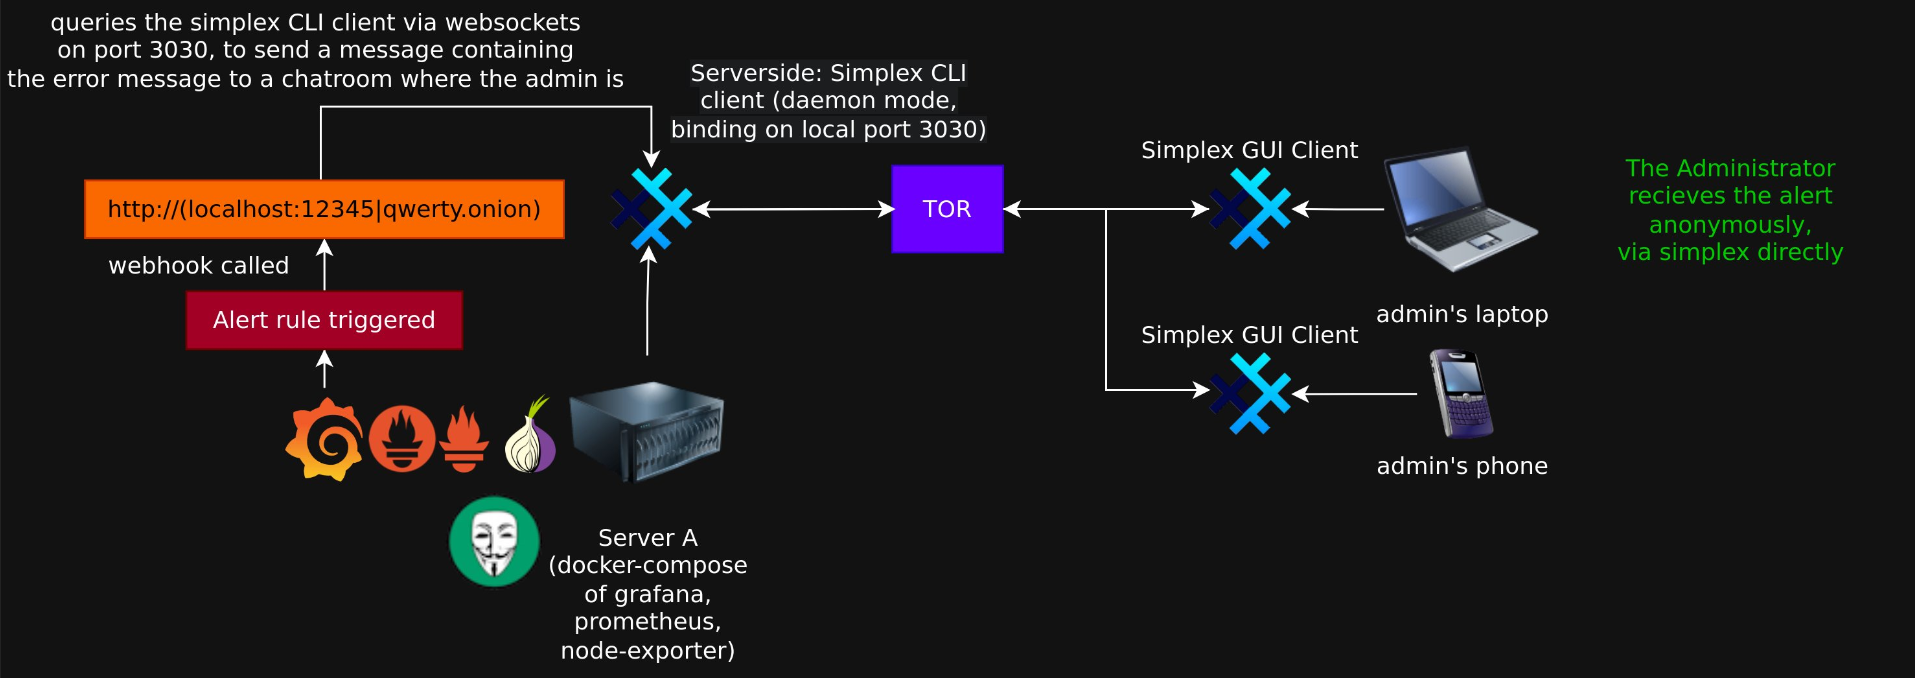
Target architecture
Simplex-chat
You can install simplex-chat from your source repository or directly from the simplex-chat release page
Download the simplex-chat ubuntu release as shown:

The release page can be accessed through your web browser or you can download the latest (at the time of writing) release with the following command:
wget https://github.com/simplex-chat/simplex-chat/releases/download/v6.2.3/simplex-chat-ubuntu-22_04-x86-64
Initializing your Simplex client
Run your client in server mode:
[user@devnode:~]$ simplex-chat -d clientDB -p 1337 -x
No user profiles found, it will be created now.
Please choose your display name.
It will be sent to your contacts when you connect.
It is only stored on your device and you can change it later.
display name: myAlertBot
Current user: myAlertBot
This command will:
- create two databases that your client uses for reconnecting to groups and interacting with the simpleX Network
- set this client display name (what you will see in your groups when receiving alerts)
- open a websocket port that the alerter will use on 127.0.0.1:1337
Grafana-Simplex-alerter
What's this code and how can I trust it?
Great question. This code runs a simple webserver using uvicorn, configures the simplex-chat client based on a yaml config file you provide it with invite links to the alert groups you want to configue.
FOSS
This code is FOSS. All of it. No secret, sauce. Furthermore it's pretty easy to analyze yourself as it's short
Dependency pinning
Everything that goes into making this code is cryptographically pinned and auditable:
- flake.lock file => python version, build-tools, and so on
- uv.lock => all libraries used by the code
Opentelemetry-enabled
Your alerting system itself should be monitored, this is can be done the following way:
- prometheus metrics: the alerter exposes a special /metrics endpoint so you can collect telemetry data about it
- continuous profiling: you have the option to connect it to a pyroscope server to get low-level per-function performance profile informations
- opentelemetry integration: connecting it to an opentelemetry collector such as alloy will give you correlated logs, traces, metrics and profiles, allowing you to easily debug and monitor it
And if you don't care about any of this: if you don't use those options no resources shall be consumed.
Building the alerter
With nix
If you have the nix package manager installed, you can simply run:
nix profile install github:MulliganSecurity/grafana-simplex-alerter
You will then be able to run simplex-alerter:
[user@devnode:~]$ simplex-alerter --help
usage: simplex-alerter [-h] [-a ADDR] [-m PROMETHEUS_CONFIG] [-o OTEL_SERVER] [-f PYROSCOPE_SERVER] [-b BIND_ADDR] [-d] [-c CONFIG] [-g] [-e ENDPOINT]

options:
  -h, --help            show this help message and exit
  -o, --opentelemetry OTEL_SERVER
                        opentelemetry server
  -f, --profiling PYROSCOPE_SERVER
                        pyroscope server address for profiling
  -b, --bind-addr BIND_ADDR
                        host:port to run the app on
  -d, --debug           enable debug mode, increases pyroscope sampling rate if configured
  -c, --config CONFIG   config file
  -g, --generate-config
                        generate config file with placeholder values
  -e, --endpoint ENDPOINT
                        simplex endpoint
With Docker
[user@devnode:~]$ git clone https://github.com/MulliganSecurity/grafana-simplex-alerter.git
cd grafana-simplex-alerter
docker build . -t simplex-alerter
For the rest of the tutorial I will show the docker commands. If you installed the alerter using nix, simply replace "docker run simplex-alerter" with simplex-alerter. Do take note of the following:
- In docker run the "--rm" parameter will be used to automatically destroy the container after it's run. If using from nix you can disregard it.
Running the alerter
Create your invite links
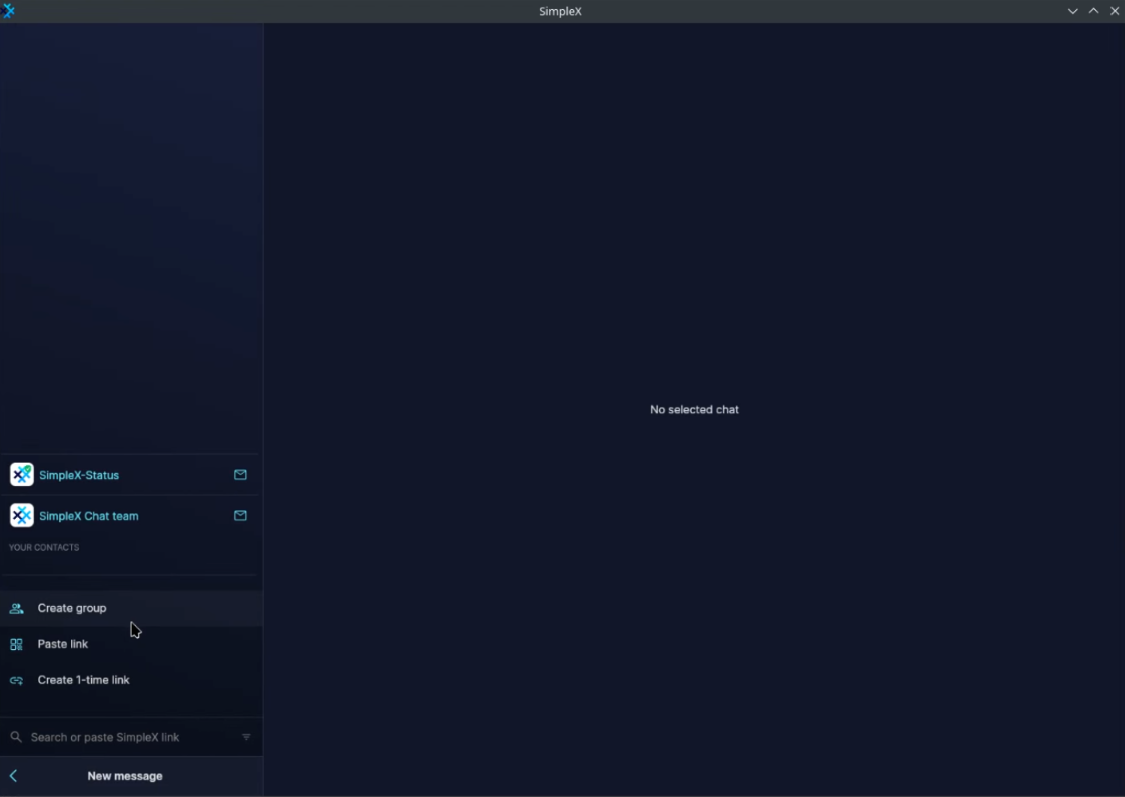
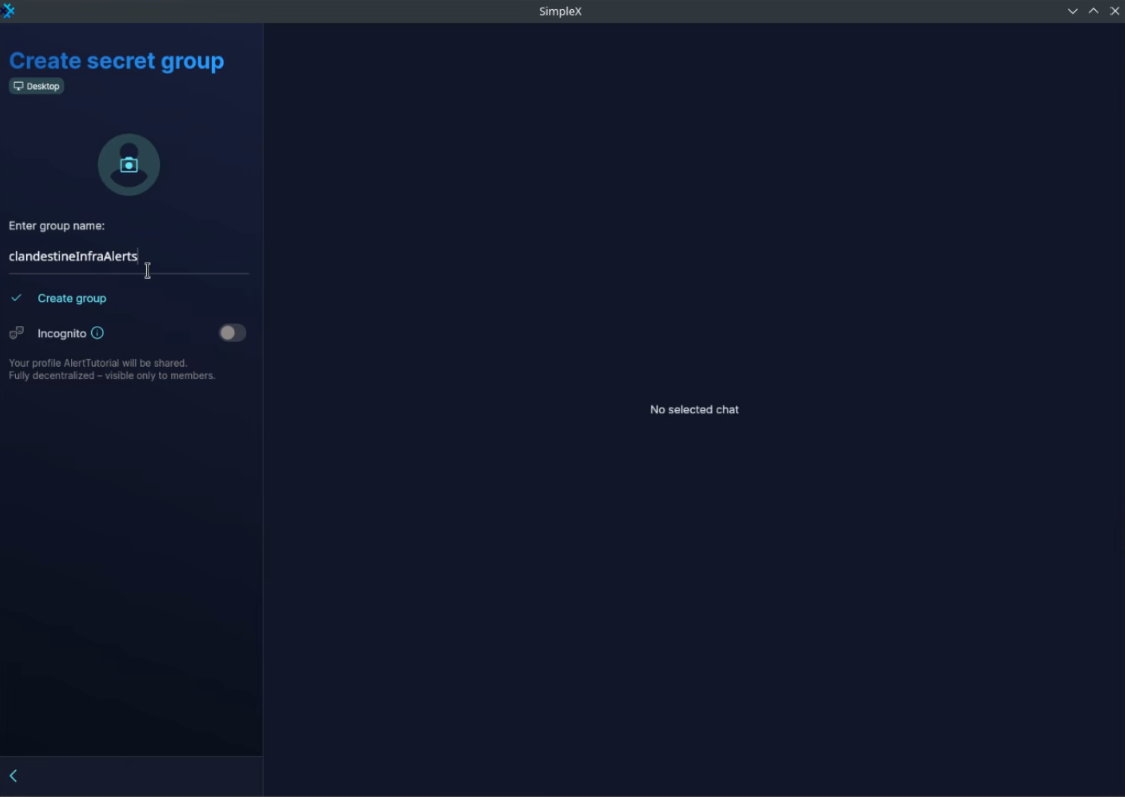
Now, on your phone or on your desktop create a group to receive alerts.
Create a group
In this tutorial I will create the "clandestineInfraAlerts" group and invite anyone from within my organization that needs to receive those alerts.
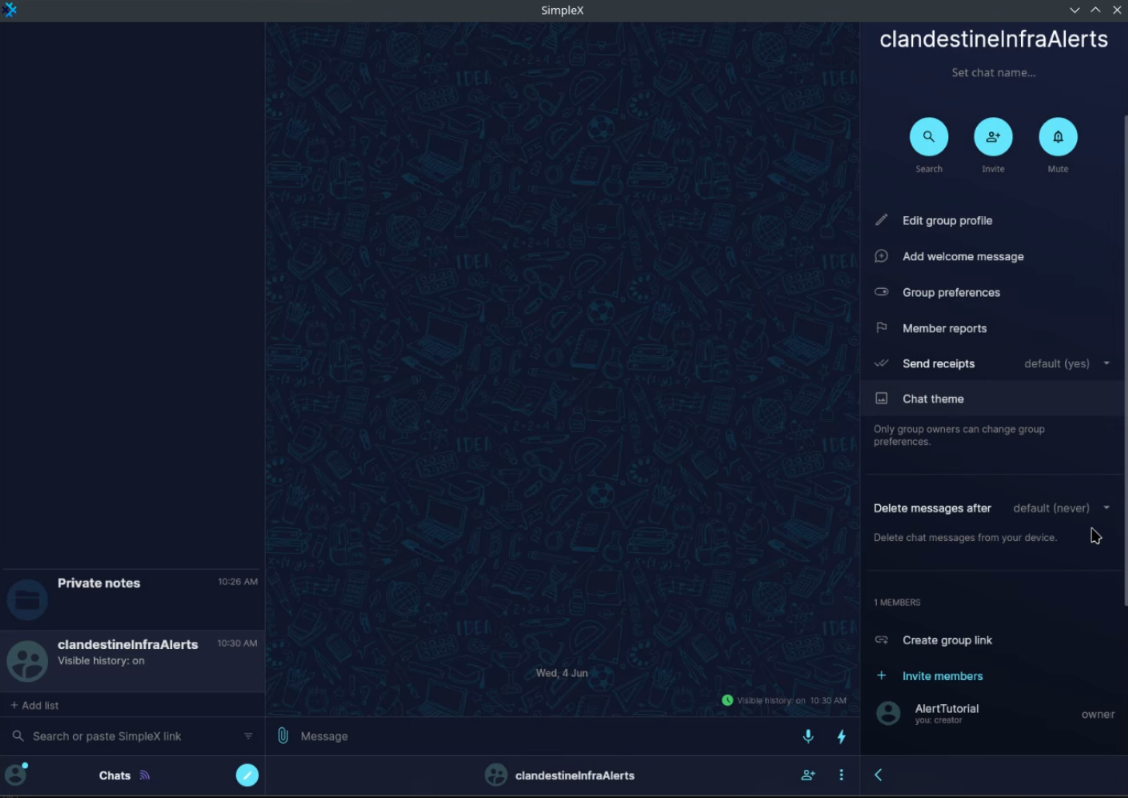
I will now need to create an invite link so the alert can send messages there:
Generate a basic config file
To get started we need a basic config file to fill out with our alerter information:
[user@devnode:~]$ docker run --rm simplex-alerter -g > config.yml
[user@devnode:~]$ cat config.yml
alert_groups:
- invite_link: https://simplex.chat/contact#/?v=2-7&sm...
  name: alert_group0
Configure the alerter
Update your config file with the invite link you created earler and set the name to your group name
[user@devnode:~]$ vi config.yml
so it looks like this:
[user@devnode:~]$ cat config.yml
alert_groups:
- invite_link: https://simplex.chat/contact#/?v=2-7&smp=smp%3A%2F%2FUkMFNAXLXeAAe0beCa4w6X_zp18PwxSaSjY17BKUGXQ%3D%40smp12.simplex.im%2FlOgzQT8ZxfF3TV_x00c0mNLMFBDkl6gj%23%2F%3Fv%3D1-4%26dh%3DMCowBQYDK2VuAyEAypkpAgfmsShNThQBGvPXxjBk8O03vKe1x0311UHhK3I%253D%26q%3Dc%26srv%3Die42b5weq7zdkghocs3mgxdjeuycheeqqmksntj57rmejagmg4eor5yd.onion&data=%7B%22groupLinkId%22%3A%22EfuyLGxGhsc0iWkqr9NYvQ%3D%3D%22%7D
  name: clandestineInfraAlerts
Start the alerter
Run the container
sudo docker run -v $(pwd):/config --network="host" --rm simplex-alerter -c /config/config.yml -e 127.0.0.1:1337
It will connect to the simplex-chat client we started earlier. You can check the metrics to make sure it's running by checking the metrics page
curl http://localhost:7898/metrics | less
# HELP python_gc_objects_collected_total Objects collected during gc
# TYPE python_gc_objects_collected_total counter
python_gc_objects_collected_total{generation="0"} 600.0
python_gc_objects_collected_total{generation="1"} 15.0
python_gc_objects_collected_total{generation="2"} 0.0
# HELP python_gc_objects_uncollectable_total Uncollectable objects found during GC
# TYPE python_gc_objects_uncollectable_total counter
python_gc_objects_uncollectable_total{generation="0"} 0.0
python_gc_objects_uncollectable_total{generation="1"} 0.0
python_gc_objects_uncollectable_total{generation="2"} 0.0
# HELP python_gc_collections_total Number of times this generation was collected
...
...
...
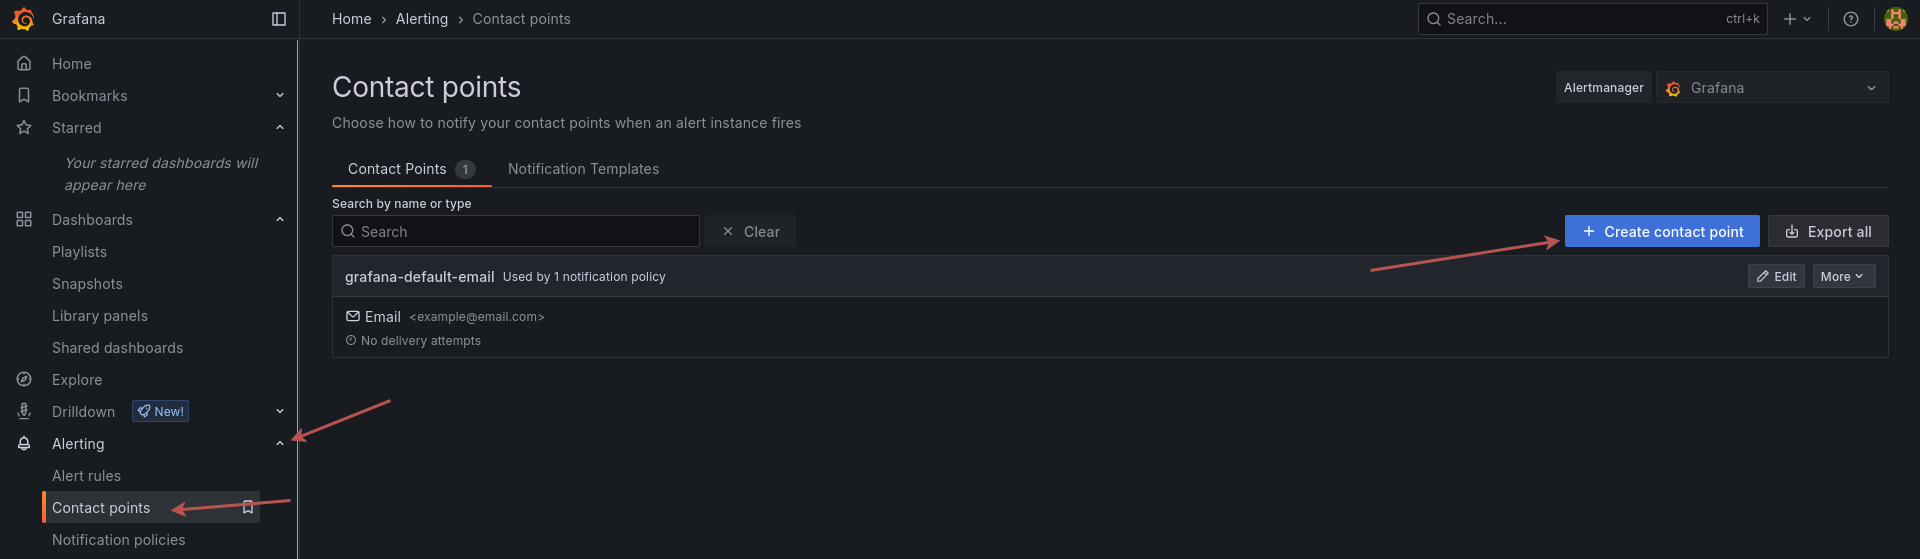
Configuring a grafana endpoint
Browse to the contact points page in grafana and click on "add a new contact point"
Fill out the details, don't forget the path after the URL, it must match your simpleX group name as it's how the alerter knows where to deliver the messages
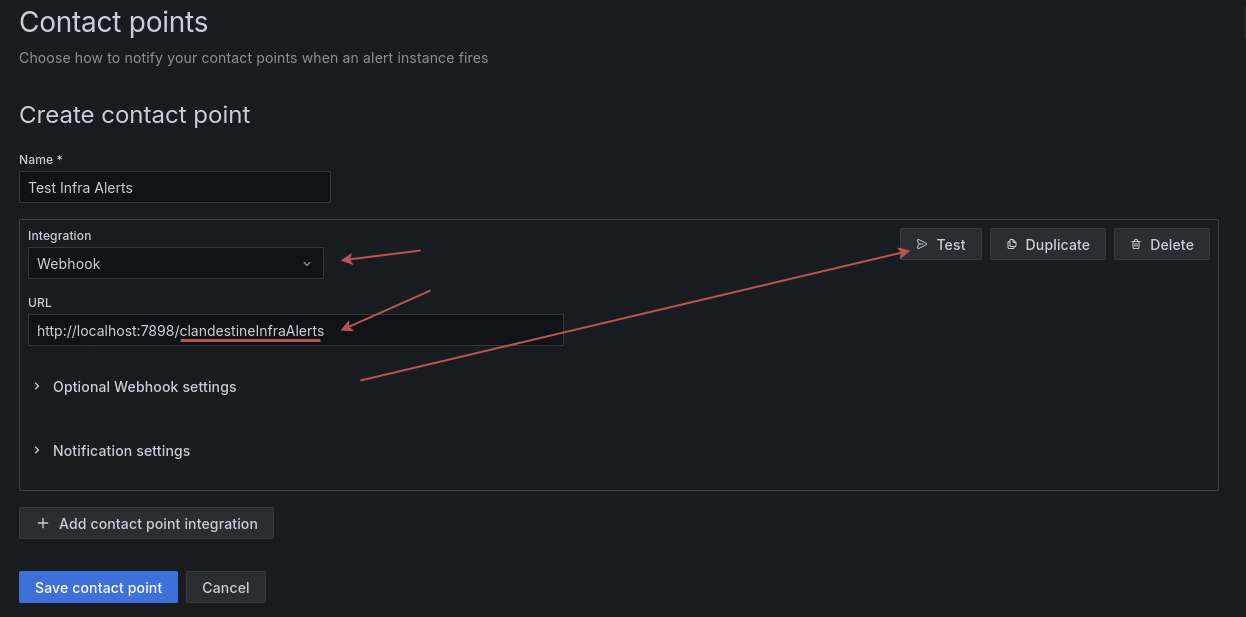
And click on Test!
Result:
Configuring an actual alert
Now that our webhook is ready we can configure an actual alert!
Go to alert rules and click on "create a new alert rule"

Now you need to configure it:
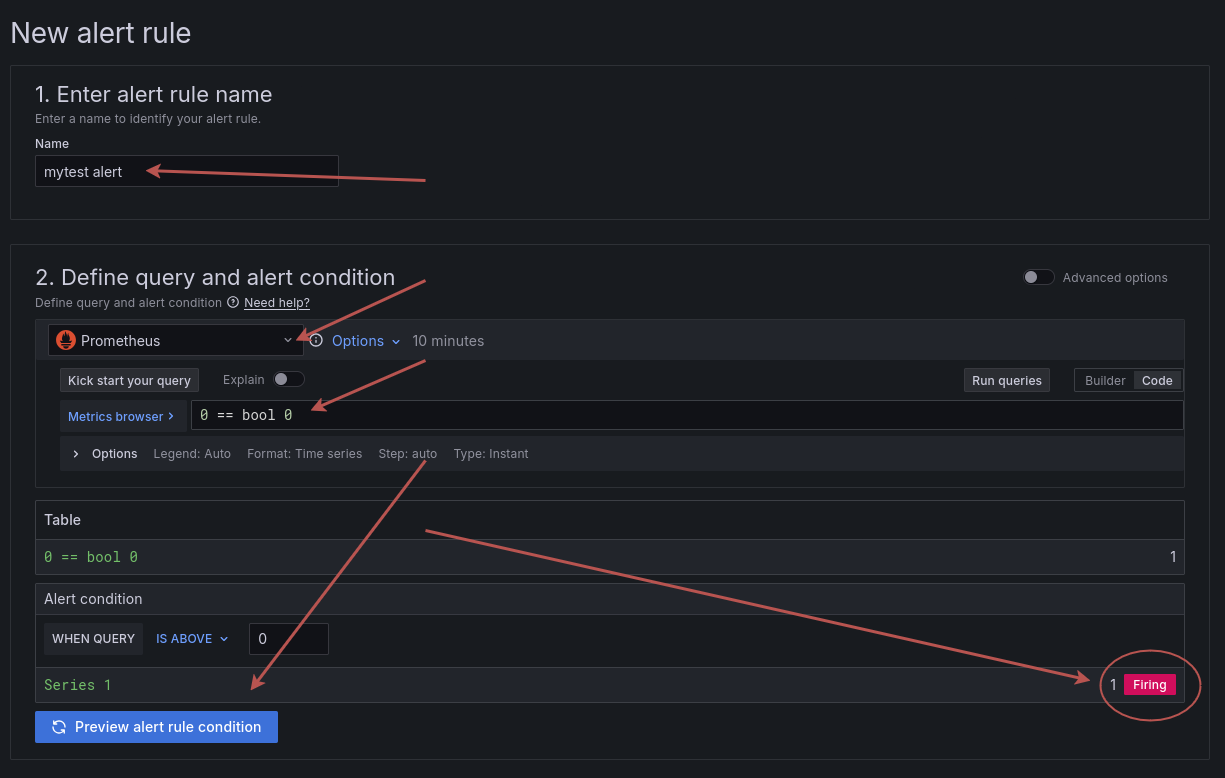
- set a name
- make sure it uses the Prometheus data source
- add an alerting condition (must be True to fire)
- Use the preview button to check that the alert would indeed be firing upon creation
A more useful alert
Since the goal of this alert is to test the end to end notification pipeline it is built to be a minimal example.
A more useful one would be the following for monitoring uptime of a server based on it's metrics endpoint reachability:
absent(up{application="node",instance="myserver5496497897891561asdf.onion"})
Keeping things Tidy
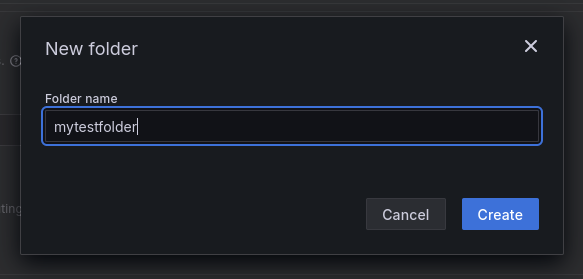
Your alert must live in a folder:
Click on "New folder"

and add a folder name
Alert Evaluation
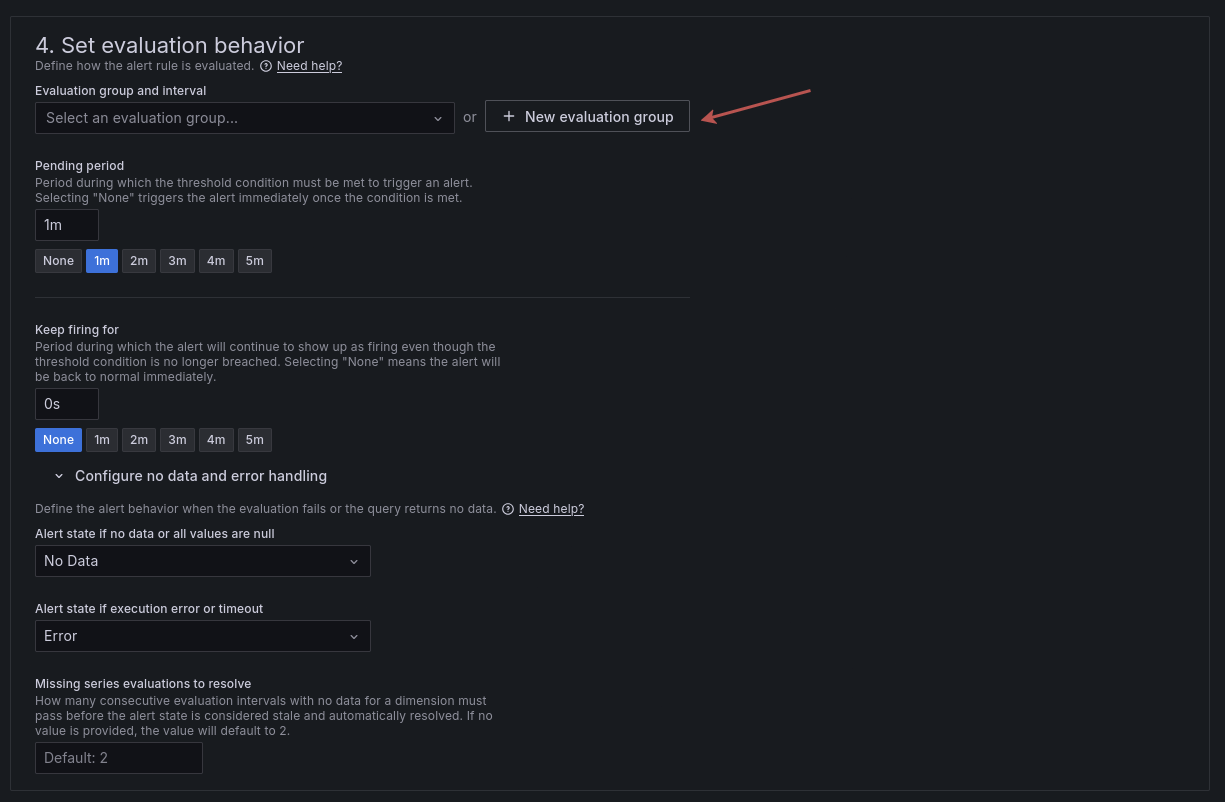
Alerts are regularly evaluated by grafana. Which means grafana will run the query at specific intervals and fire the alert if the conditions specified are filled.
Let's imagine that we want to keep a close eye on this alert, as if 0 ever not equals 0 then we will have big problems.
First configure an evaluation group and set its name. You can leave the one minute evaluation timing as it's the shortest.
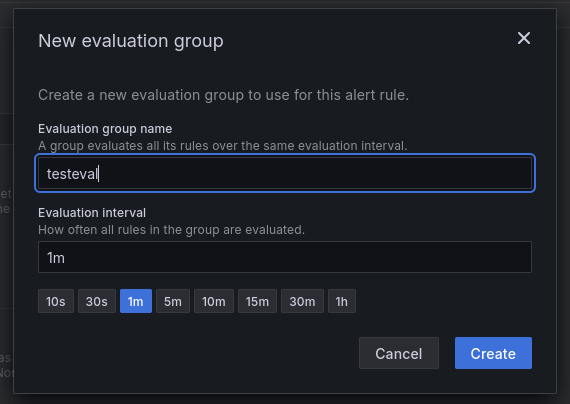
You can leave all other options to their default.
Alert Contact Point
Now we are going to use the alert contact point we created earlier:
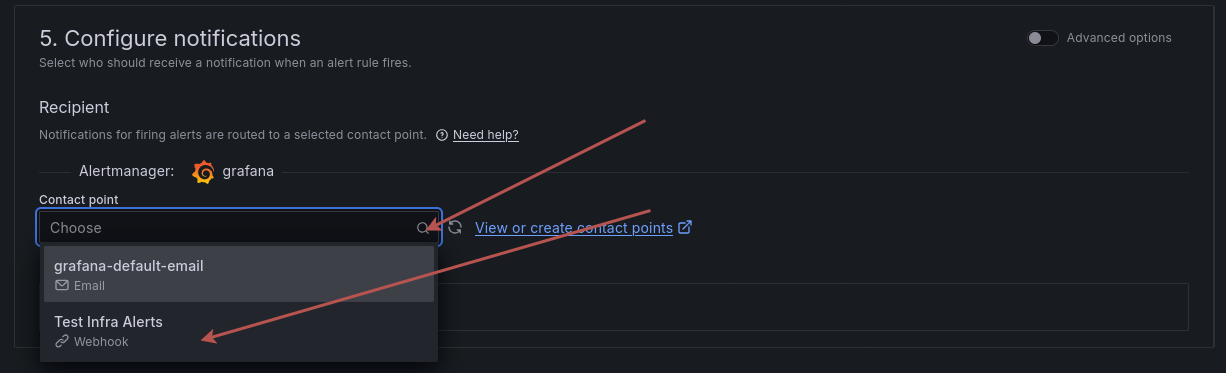
Choose from the drop-down menu the web hook we configured.
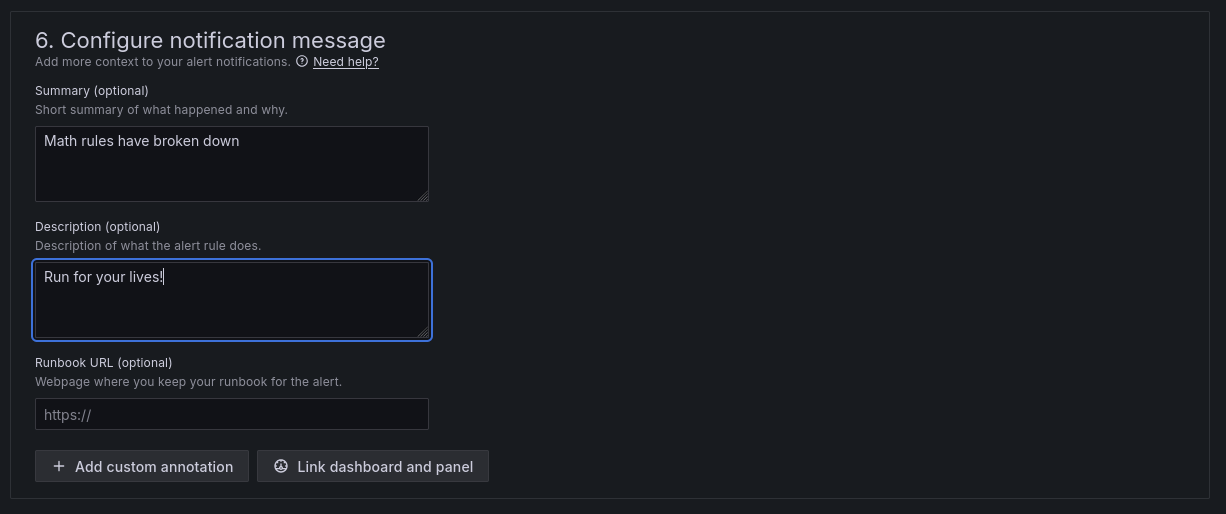
Alert Message
When the conditions are fulfilled you want an information to be conveyed: that's where you configure it
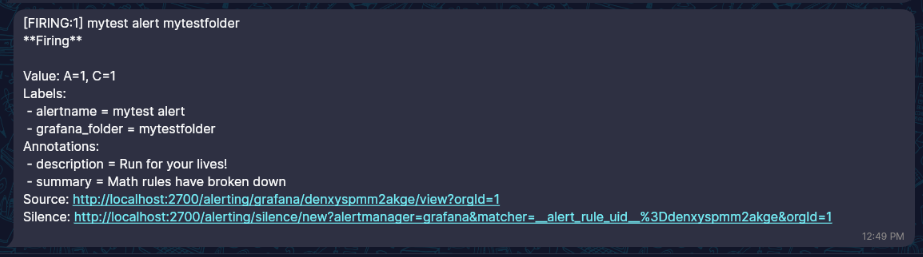
And now let's blow up some phones
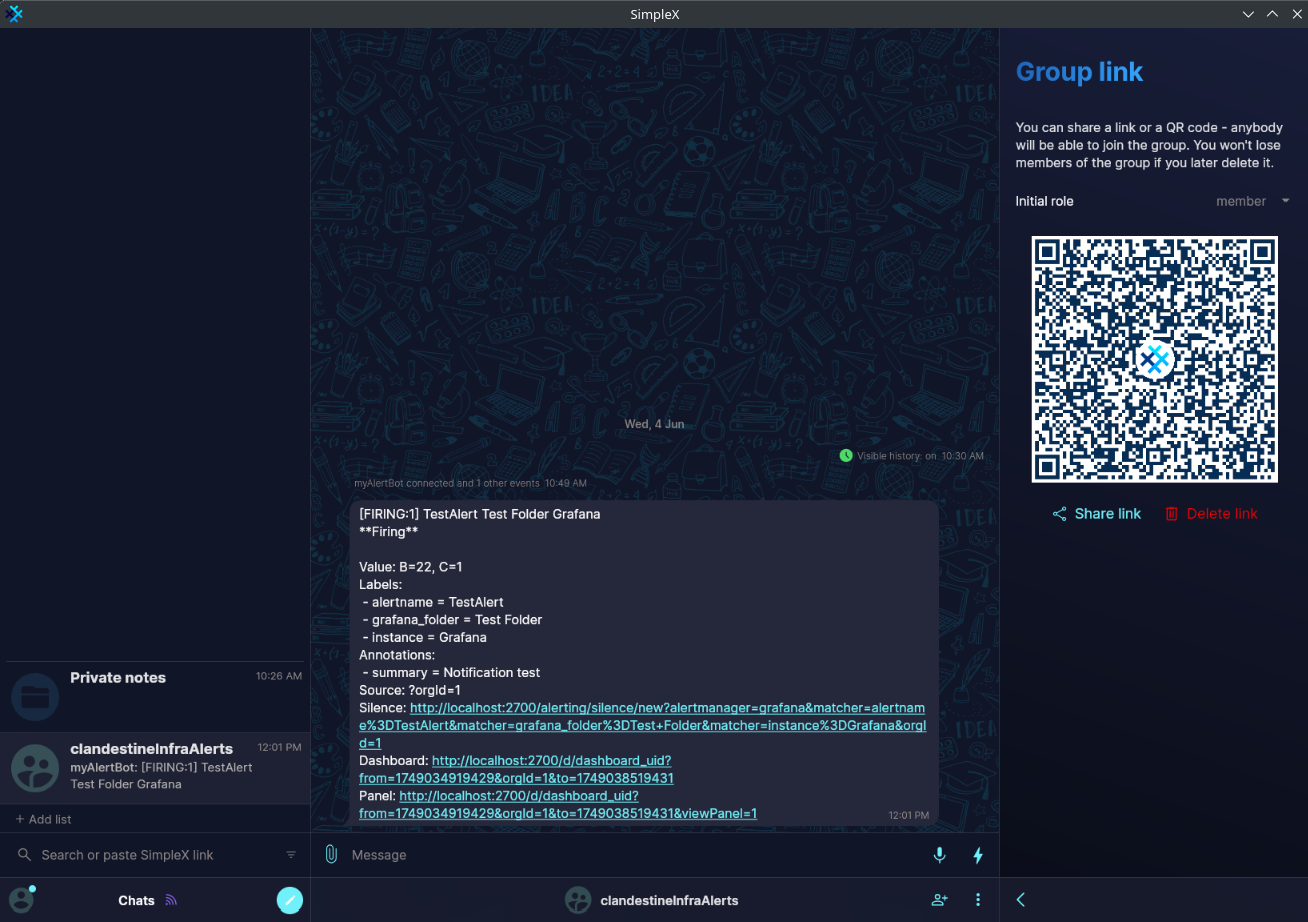
Save the rule and exit, in 1 minute it will be evaluated and you will receive a a notification

And here's the alert:
Configuring those systems as systemd services
To turn the simplex-chat and the alerter into systemd services, you only need to create two files:
/etc/systemd/system/simplex-chat.service
 vim /etc/systemd/system/simplex-chat.service
 cat /etc/systemd/system/simplex-chat.service
[Unit]
Requires=tor.service

[Service]
ExecStart=simplex-chat -d /etc/alerter_clientDB -p 1337 -x
[Install]
WantedBy=multi-user.target
/etc/systemd/system/alerter.service
vim /etc/systemd/system/alerter.service
cat /etc/systemd/system/xxx
[Unit]
Requires=simplex-chat.service

[Service]
ExecStart=docker run --rm simplex-alerter -c /etc/alerter-config.yaml -e 127.0.0.1:1337

[Install]
WantedBy=simplex-chat.service
Enable the services
Now enable the services
sudo systemctl daemon-reload
sudo systemctl enable --now simplex-chat.service
sudo systemctl enable --now alerter.service
Conclusion
We now have an easy way to set multiple alerts to different groups based on our monitoring system, furthermore those alerts will be sent over tor through a privacy-preserving messaging system.